How to use Google Spreadsheet for your cryptocurrencies portfolio overview
Over the past few months, I got involved in the world of cryptocurrencies and I played a bit trading some of them. After a few days, it was more than clear that I needed a simple and effective way to keep an eye on the crazy by-the-hours ups and downs of the markets and get a sense of the performances of my small portfolio.
Warning: trading cryptos may cause dependency and should be avoided at all costs 😆
Since I didn’t want to use yet another App or another website and being quite familiar with Google Spreadsheet and JavaScript I thought that it would have been interesting to create something myself using those tools.
This is how the spreadsheet looks like right now (with imaginary quantities and cryptos, of course).
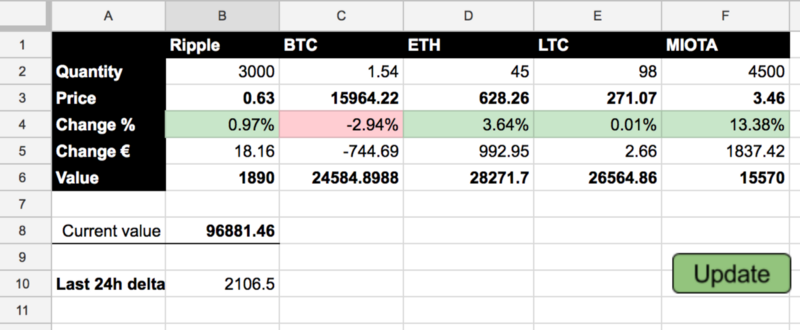 The final result
- Row 2 is the quantity you own of a specific currency
- Row 3 is the current unit price (we’ll see how to automatically get it)
- Row 4 is the change in the last 24h
- Row 5 is the (calculated) change in €
- Row 6 is the actual total value of the asset
- B8 and B10 are the
sum()of row 5 and 6 respectively
Formulas:
- Row 5 cells are
=ROUND(B6 - ((B6 * 100) / (100 + (TO_PURE_NUMBER(B4) * 100))), 2)(adjust for B6 and B4 of course) - Row 6 cells are
=ROUND(MULTIPLY(B3, B2), 2)(adjust for B3 and B2 of course)
The spreadsheet would already works once you manually fill Row 3 and Row 4, but it’d be much nicer (and useful) if we could ask an external service to give us the values and fill them directly in. All the other values will popup fresh anew in a moment.
Write a script to fetch the data
It is as simple as opening the script editor and copy pasting the code I will give you. Look:
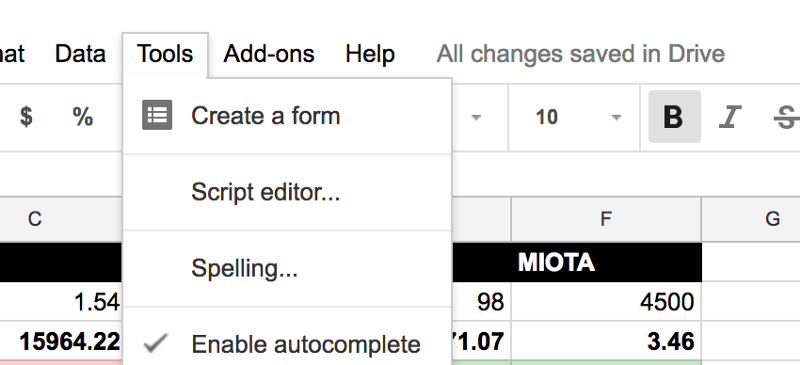 From the Tools menu, select "Script editor…"
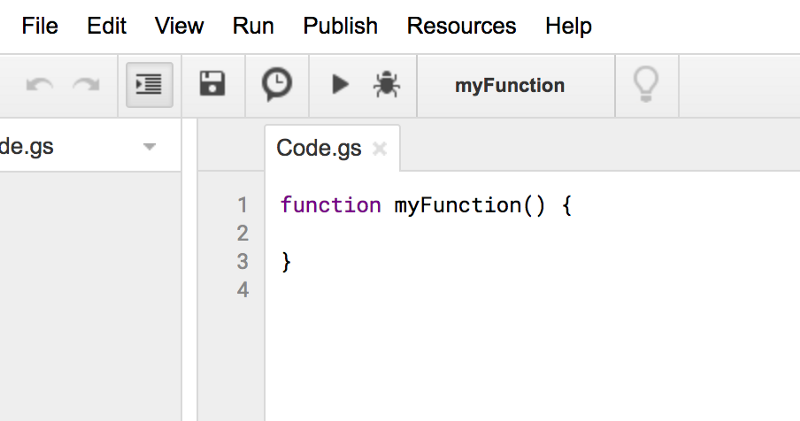 The script editor, as it looks like once you open it
Now replace the content of the “Code.gs” file with what you’ll find in this gist.
Your script editor should now look like this:
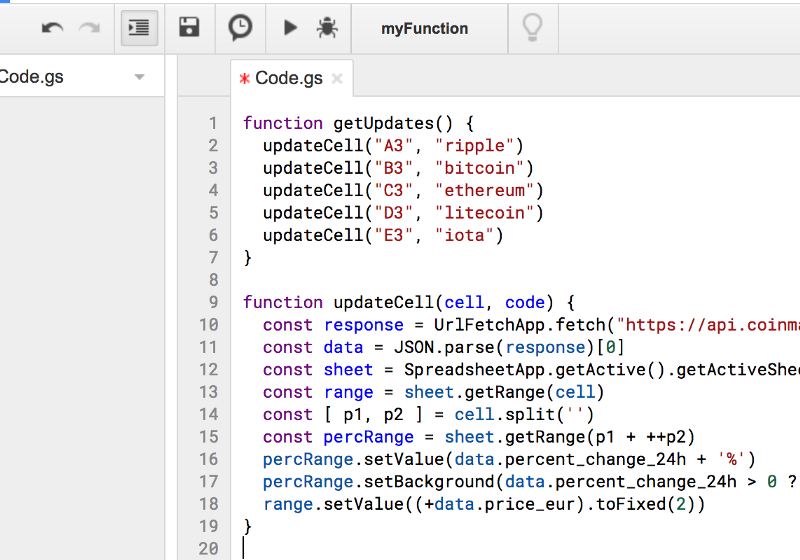 Warning: the actual code may look a bit different from this screenshot in case I update it
The script uses the Coinmarketcap open API to get the prices and percentages you need. You have to change the name of my cryptos with the ones you’re interested into, obviously.
If you are already thinking about customizing the script, beside the obvious change in the name of the cryptos, keep in mind that the script looks for the the cell below the one you specify when using the updateCell function (so in the script above, they will be B4, C4, etc.) to put in it the value of the percentage (yes, a bit convoluted but it works for me). The lines involved in this trick are 14–17.
Save the script (Ctrl+S or the menu option), give it a name when asked and let’s get back to our sheet.
Now you need a “button” that when clicked will run the script, which in turn will fill in the values of your nice sheet. From the “Insert” menu, select “Drawing”. You’ll then have to draw some sort of figure resembling a button (or anything else, this is really up to you).
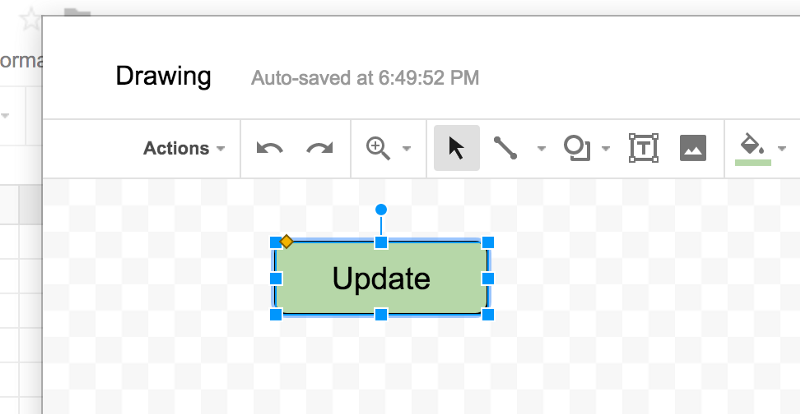 This is me designing my shiny greeny button
Save and close, and your button will be just there floating on top of your sheet: you can move it around or even change its dimensions at will. Now, right click on the button (that is, open its contextual menu from the “three dots” item inside the button itself) and select “Assign script…”. A popup will open asking you to enter then name of the script. Enter getUpdates and close the popup (it’s the name of the first function in the script).
Now if you click the button Google will ask you about granting some sort of permissions to run the script. It’s OK, because youjust wrote it, so keep confirming until your script will finally run.
And that’s it. Enjoy!
Written on December 18, 2017 by Claudio Cicali.
Originally published on Medium